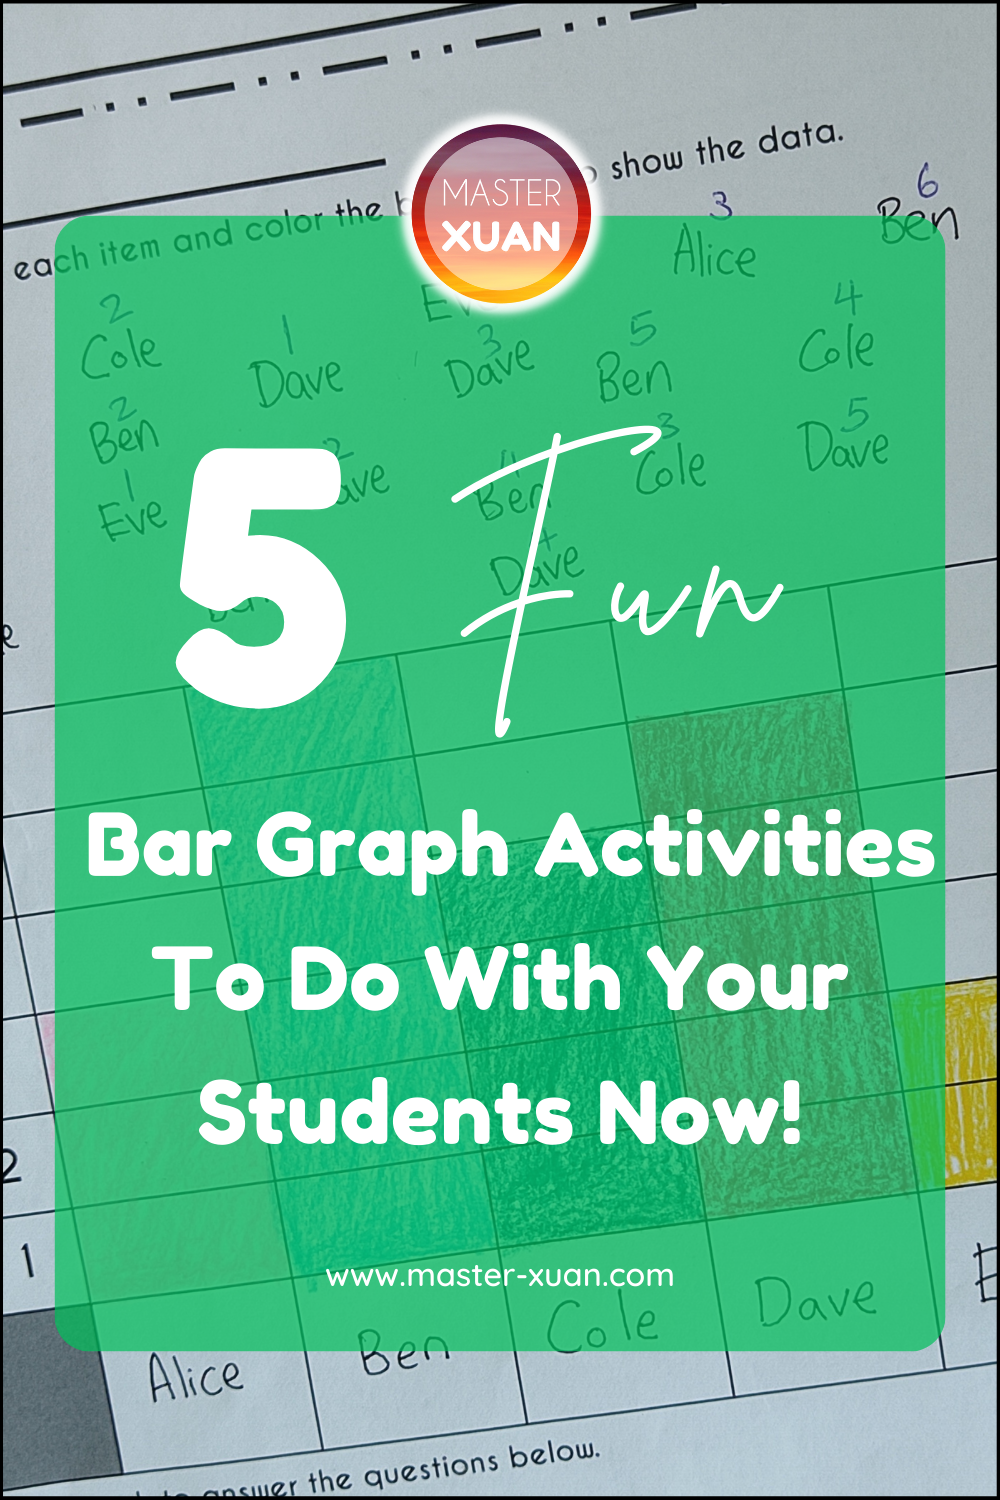
Looking for fun bar graph activities? Or preparing lesson plans for teaching bar graphs?
You came to the right place!
Instead of just doing worksheets, I’m going to share with you the 5 ways we can spice things up.
I’m not saying that we don’t need the usual worksheets when teaching graphs to elementary students.
Instead, we need something extra to make lessons more interesting. We need to engage them so that they will remember the concepts and retain the knowledge better.
Of course, it helps that when they have fun, they are happy and we are happy.
1) Surveys
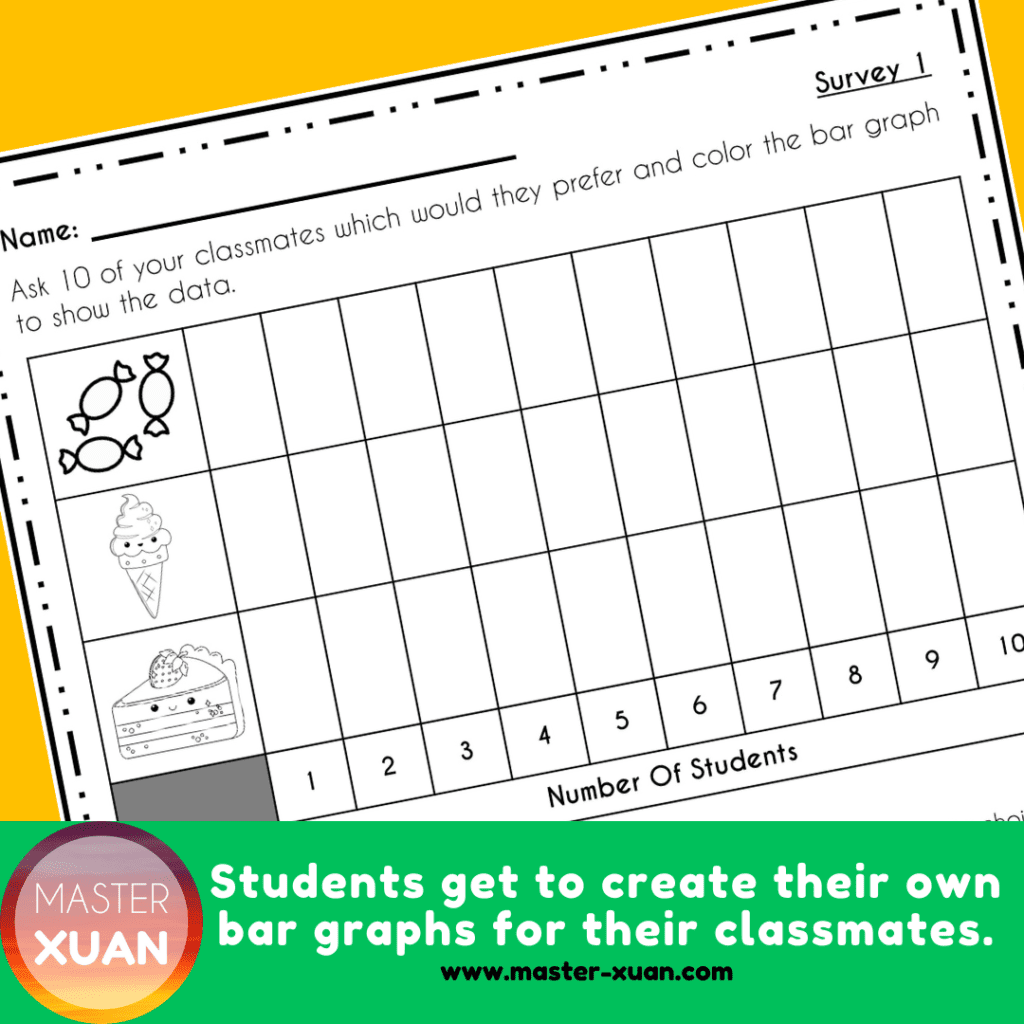
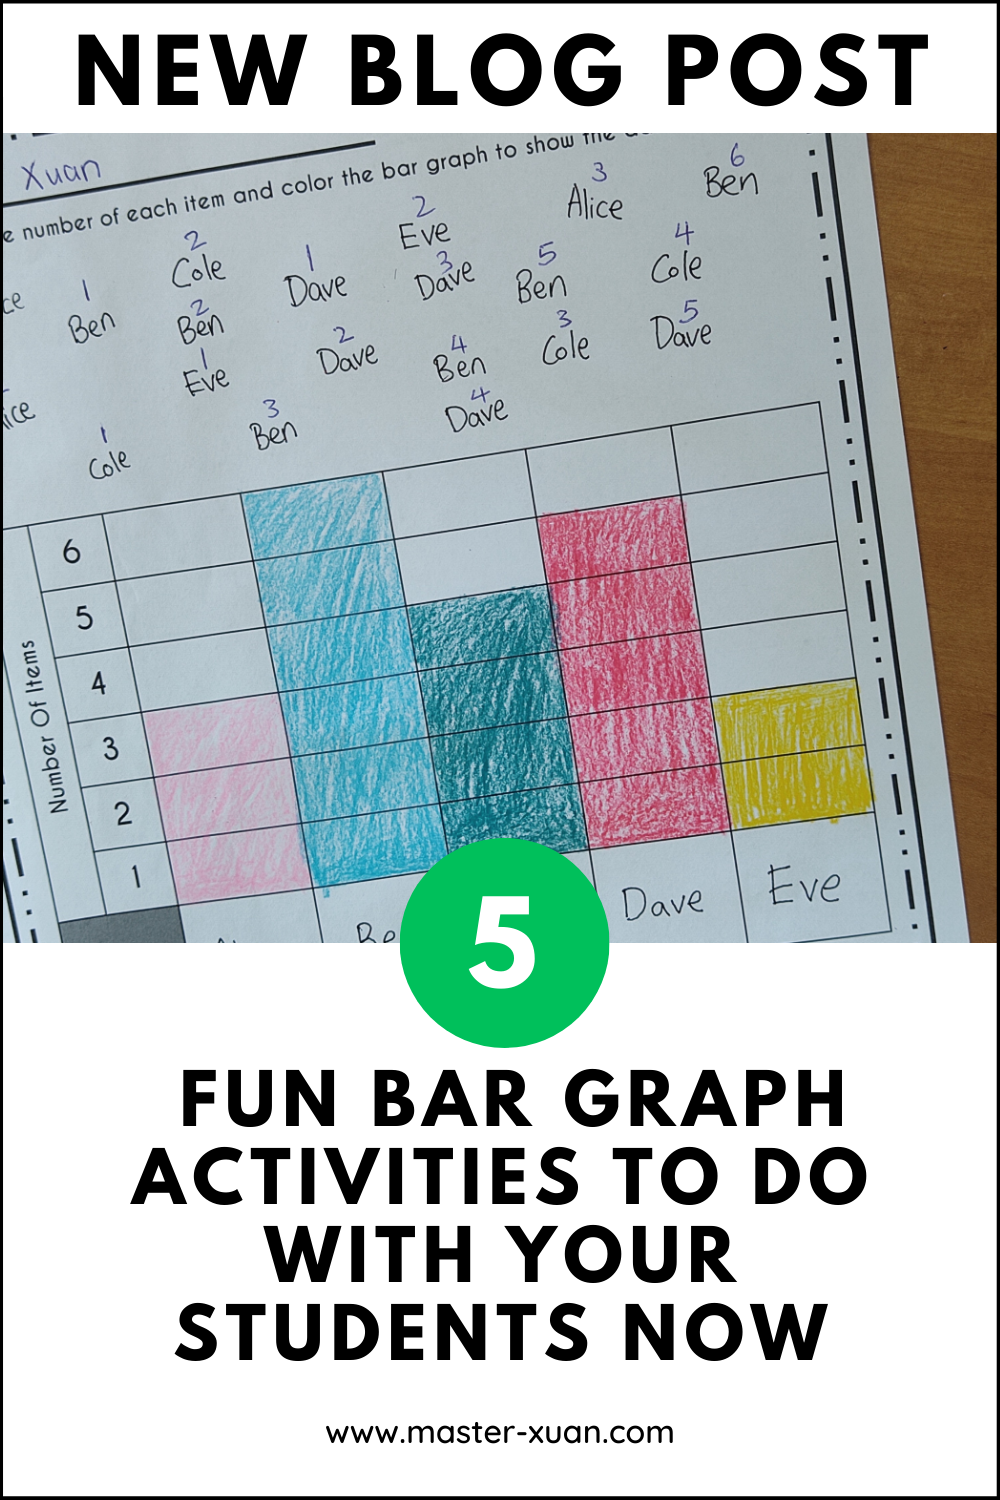
We can ask students to survey their classmates to create their unique worksheets.
Students will be more interested to create and solve questions that relate to the real world. Especially when it gives them excuses to speak to their classmates during lesson time.
Of course, if you wish to keep the volume down. You can be the one asking questions and tally down the results.
Students will also be engaged as their curiosity is roused as they get to know their classmates better.
To add some more interest, instead of the usual raising of hands, you can ask them to show certain actions if they vote for a certain option.
2) Pair-Up Activity
Let your students role-play as a teacher!
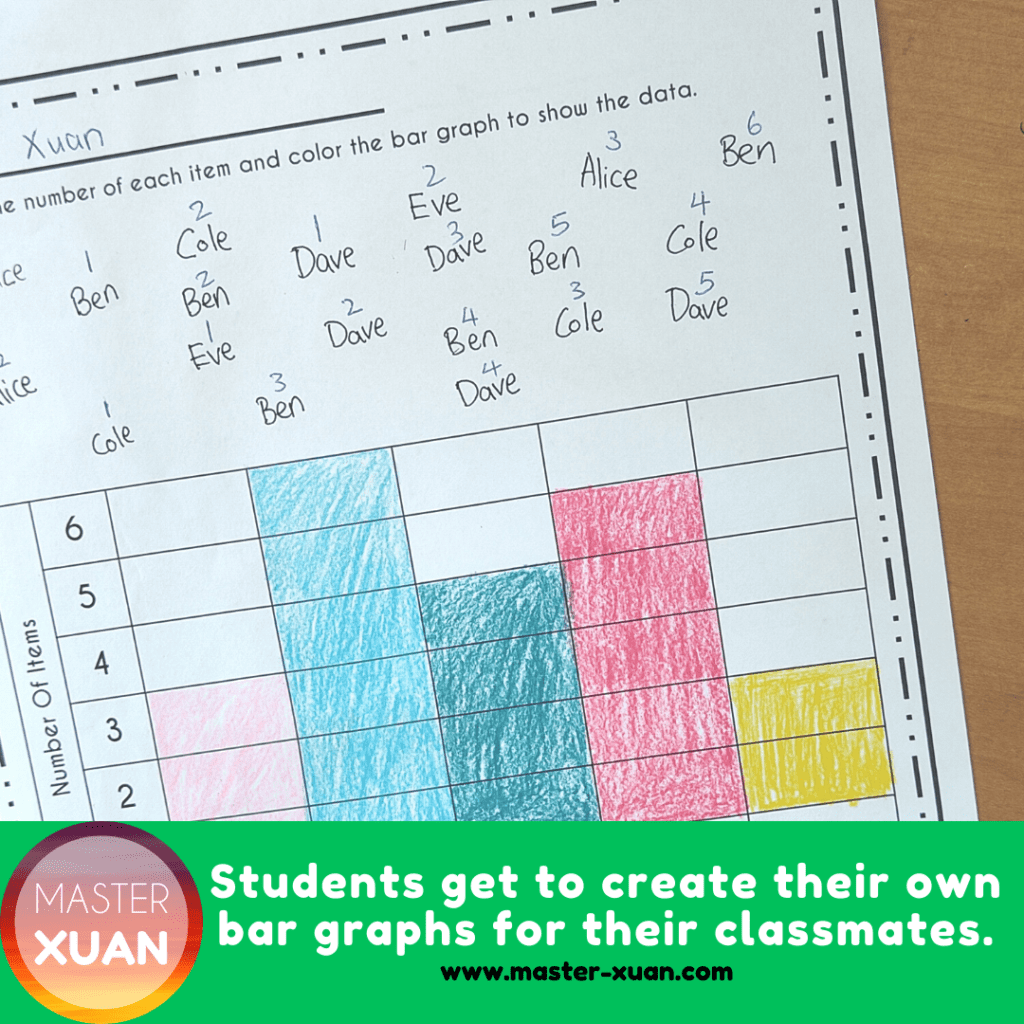
- Make them set their own questions for their partner. To make it easier, they are only responsible for drawing the number of items.
- Exchange the worksheets.
- Complete the bar graphs and questions.
- Exchange the worksheets again to mark for their partner.
This way, not only do they get to draw and interact with their classmate, but they also get to do 2 sets of worksheets. They will have so much fun that they didn’t even realize that they are doing double the work! 😋
3) Roll Dice/Spinner
To add some interest and for independent work, instead of surveying, students get to create their own unique worksheets using dice.
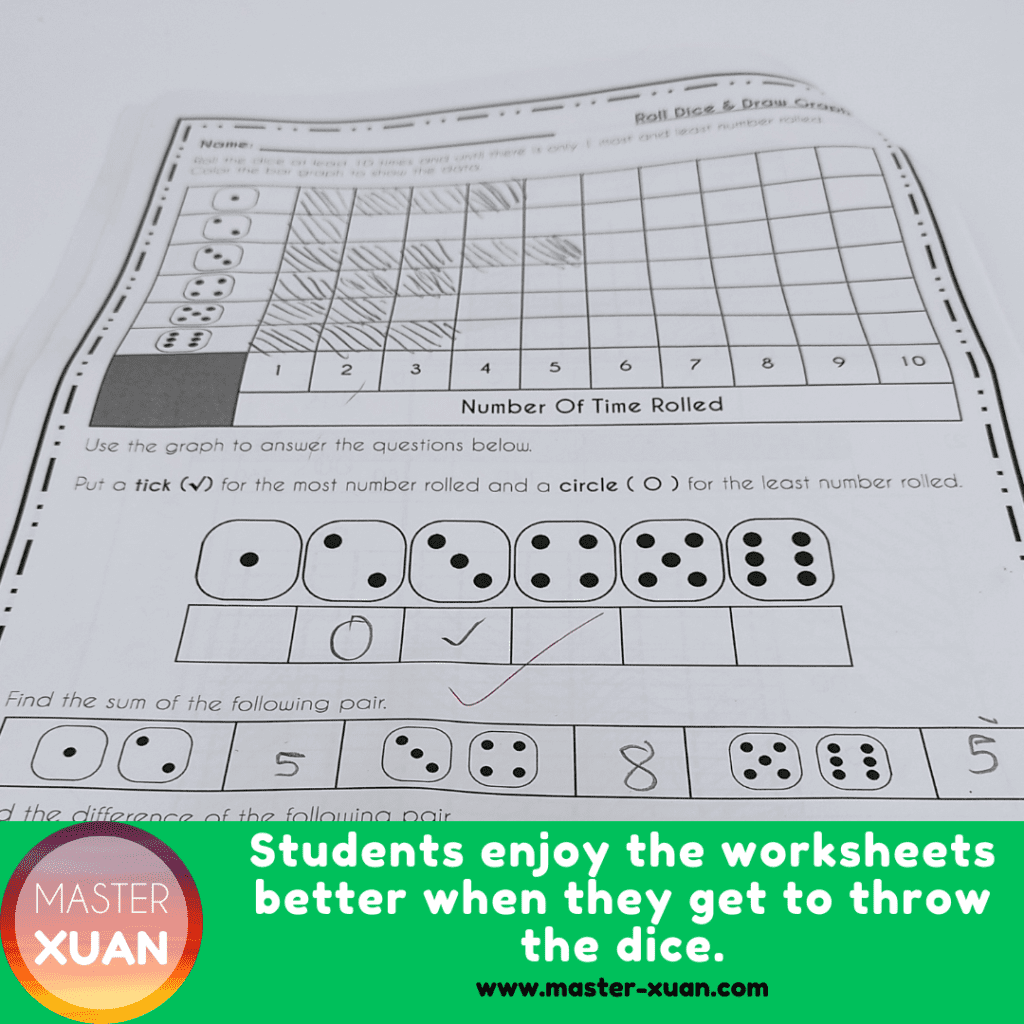
Students will throw the dice at least 10 times and complete the bar graphs. If there is a tie for the most or the least number rolled, students will continue throwing the dice.
This is because later on there is a question asking students to differentiate the most and least number rolled.
If you don’t have dice, using a spinner or digital dice (Search Youtube for dice) also works.
4) Coloring
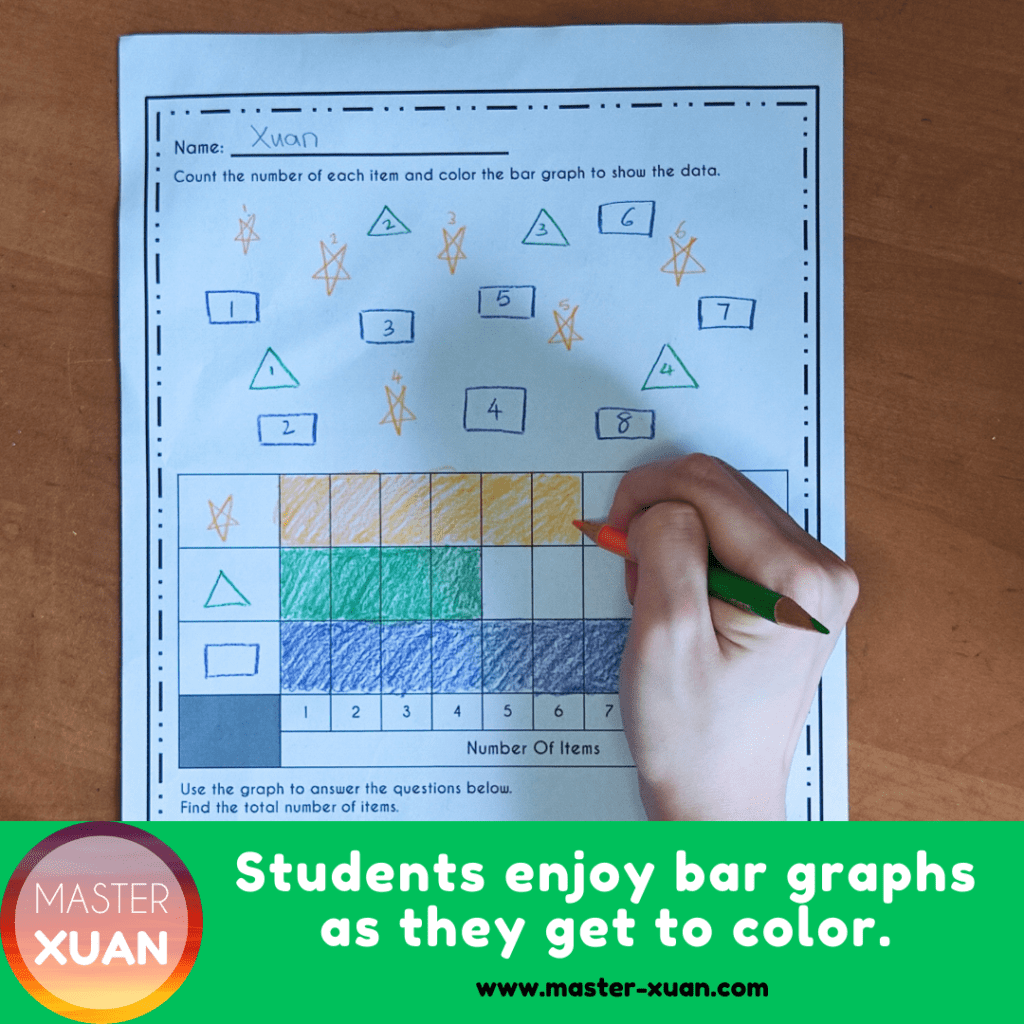
Many students like coloring, so it is no wonder to incorporate them too.
Students can use colors to make their worksheets more colorful and personalized by coloring the bar graphs.
If you think coloring takes up too much time, you can ask them to shade or doodle instead.
5) Group Activities
Ask students to act out the bar graphs as a team.
To do so, first, split the class into groups of an equal number of students.
Then, place the names of the variables (Apple, Pear, Mango) on the ground or let the first students of each line hold them.
Next, show or tell the conditions and let them move around to show you the possible bar graphs.
For example,
Conditions:
- The number of Apples sold was twice the number of Pears.
- The least number of fruits sold was Mango.
If each team has 10 students,
- 6 students will stand in line with Apple
- 3 students will stand in line with Pear
- 1 student will stand in line with Mango
You can make it a timed competition (whereby students have to stop moving in 30 seconds) or just a movement activity (as long as they complete it, it’s fine).
A smaller team will help reduce mess, easy calculations and ensure every student gets to move (just add in the clause that they can’t stand at the same line each round).
However, it can be fun too if you play as a whole class. Try it out and share with me your experience!
To make things easier, you can choose to show them a bar model and ask them to “copy” it within a certain time frame.
Conclusion
Love all the activities mentioned above?
Save time and effort with Worksheet On Bar Graphs!

🌟Key Features:

- 26 Bar Graphs Worksheets
- 7 Different types of worksheets
- 2x Count & record worksheets
- 2x Draw bar graphs with titles
- 6x Draw bar graphs using data from the table
- 3x Surveys and draw bar graphs worksheets
- 1x Roll dice and draw bar graph worksheet
- 12x Data analysis / bar graphs interpretation worksheets
- 4x Templates to make your own graphs
- Different intervals/scales on axis
- Vertical & Horizontal Bar Graphs
- Fun & Engaging
- No Prep
- Economical printing: Black & White
- Digital and Print format: Printable & Easel
- Singapore Primary 3 | 2nd & 3rd Grade
✏️Great for:
- Math Centers | Math Stations
- Practice or Drills
- Homework
- Bell Ringer / Morning Work
- Quiz
- Exit Tickets
- Independent Work
- Early Finishers
- Review
Buy Worksheet On Bar Graphs and enjoy bar graphs with your students today! ✌
Related read: 3 Online Math Winter Activities Kids Actually Found Fun And Interesting
Bookmark this post by saving the pin to your Pinterest Board now! ↓
